Visual data creation & management system
Overview
Datagen allows companies to create and manage visual data for training AI models
Goal
After creating images, we want to allow users to explore and investigate hundreds of thousands of images and also to search by each and every metadata parameter of the image and find exactly what the users are looking for (out of 60 parameters for each image)
After creating images, we want to allow users to explore and investigate hundreds of thousands of images and also to search by each and every metadata parameter of the image and find exactly what the users are looking for (out of 60 parameters for each image)
Challenges
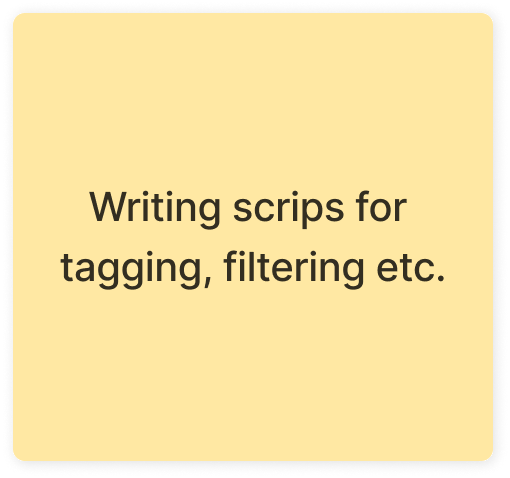
Now users do not have a management tool for all the visual data they create. They need to download it locally to their computers and go over the data, organize it, look at it, tag it, and then use it to train AI models.
The engineer must be able to search for large amounts of data and on the other hand, to investigate the data in high resolution one at a time.
Research
First, I interviewed our internal AI team to get some sense and info about their workflow.
Furthermore, I conducted a competitive analysis to evaluate existing data management platforms.
This analysis helped me identify their strengths, weaknesses, and opportunities for differentiation.
First, I interviewed our internal AI team to get some sense and info about their workflow.
Furthermore, I conducted a competitive analysis to evaluate existing data management platforms.
This analysis helped me identify their strengths, weaknesses, and opportunities for differentiation.
Competitors
Persona
Pain points


Key needs from research insights
• Filter on big amounts of data
• Filter on big amounts of data
• Explore the data
• Organize and tag the data
• Visual investigation
User flow
Wireframes sketching
Creating data
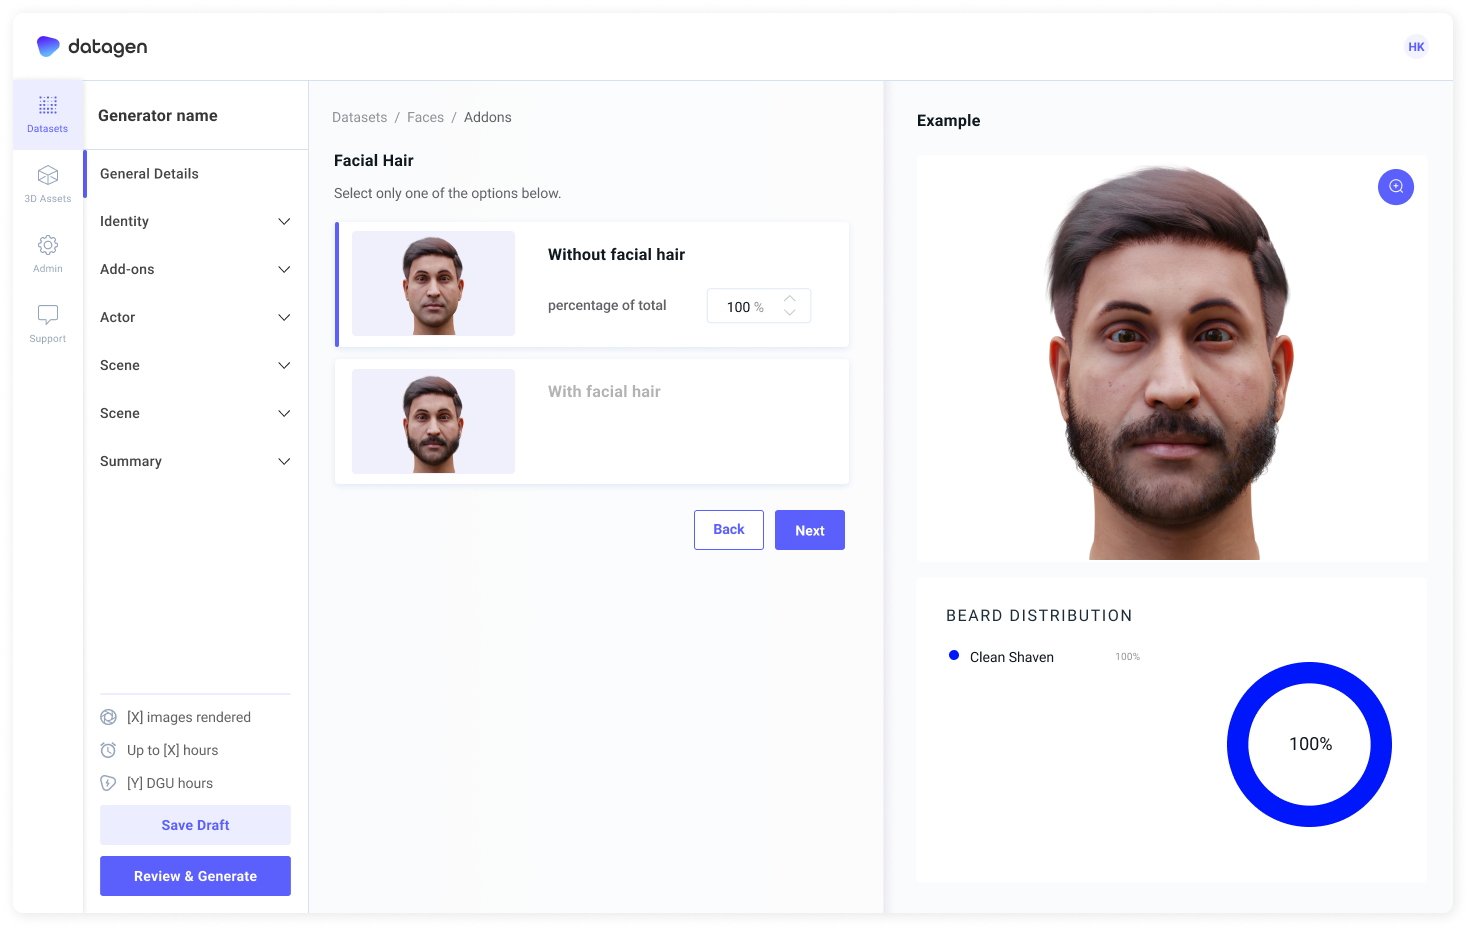
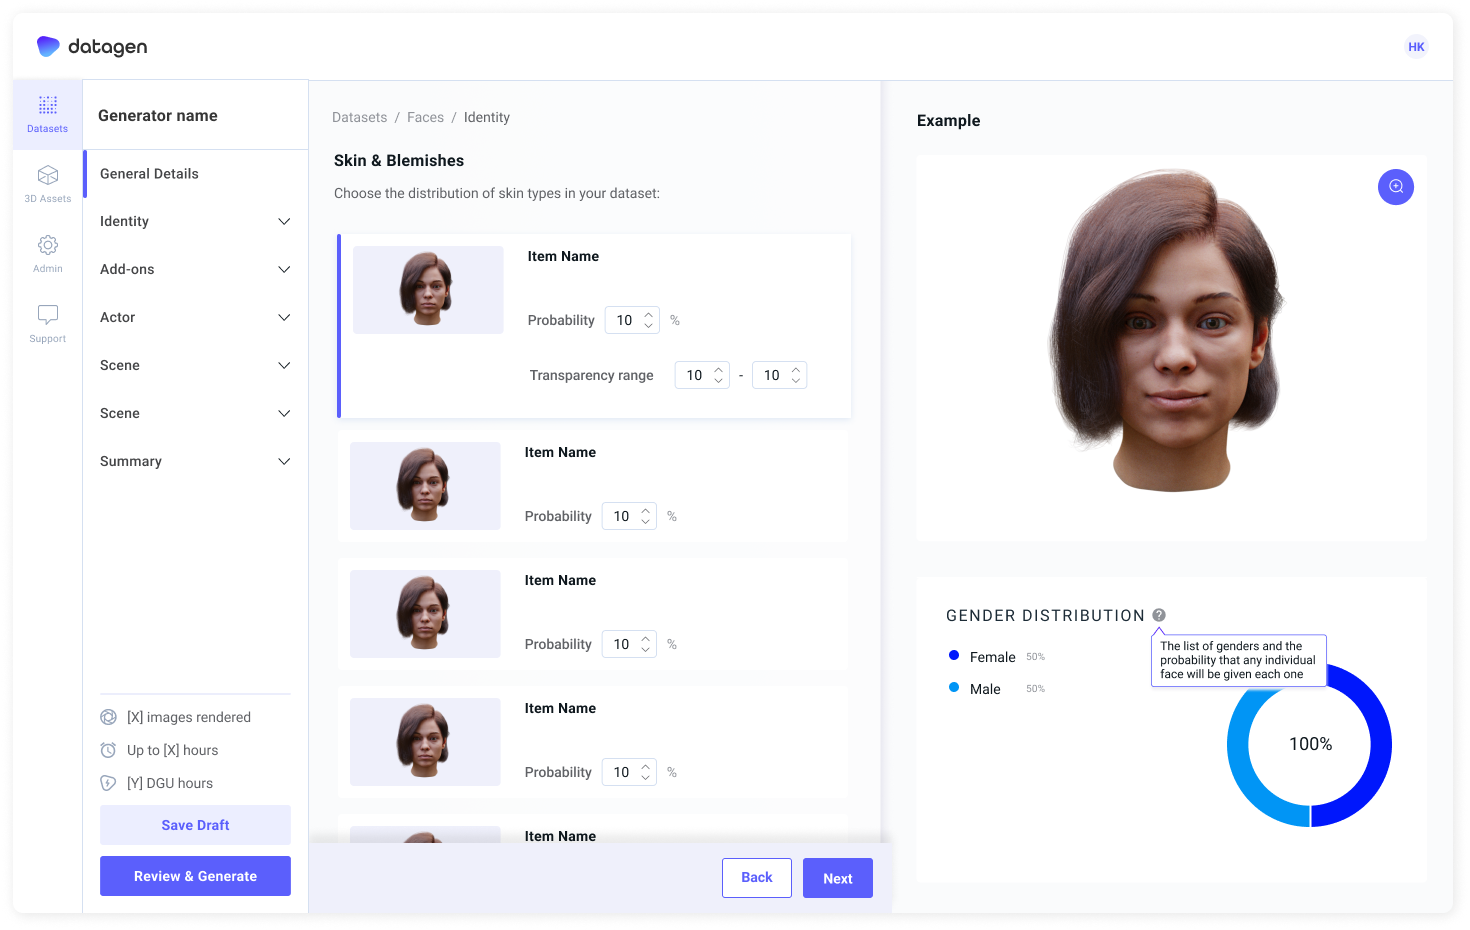
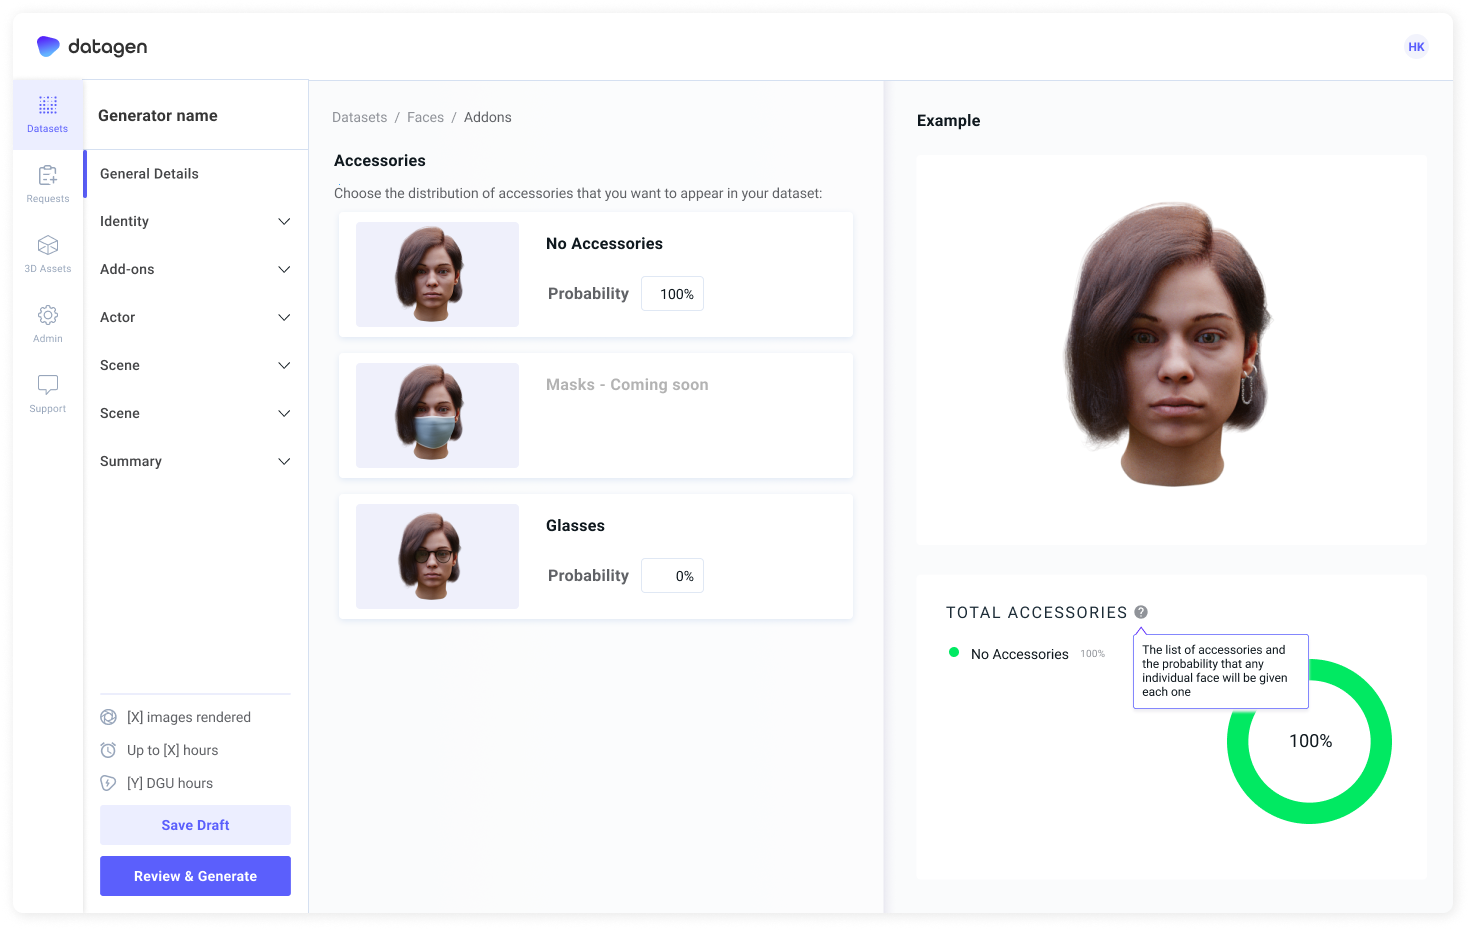
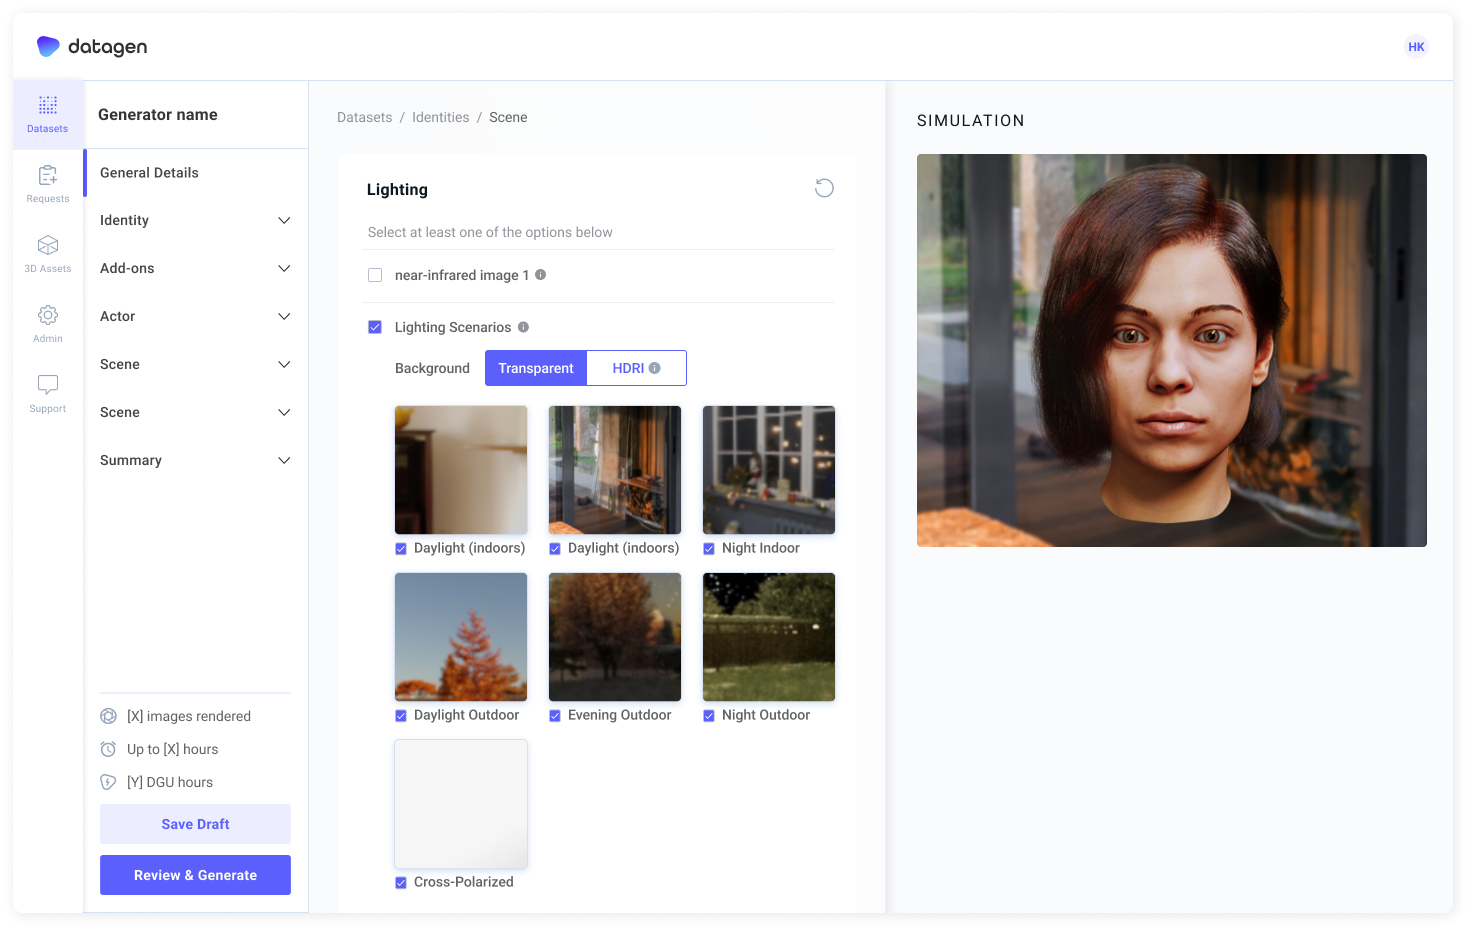
First, users must define which human they want - age, gender, and ethnicity. Then accessories, expressions, and eye gaze. After all that, the user needs to choose lighting and set the camera position and field of view.
Then they will proceed to a summary page that displays all of the chosen parameters.
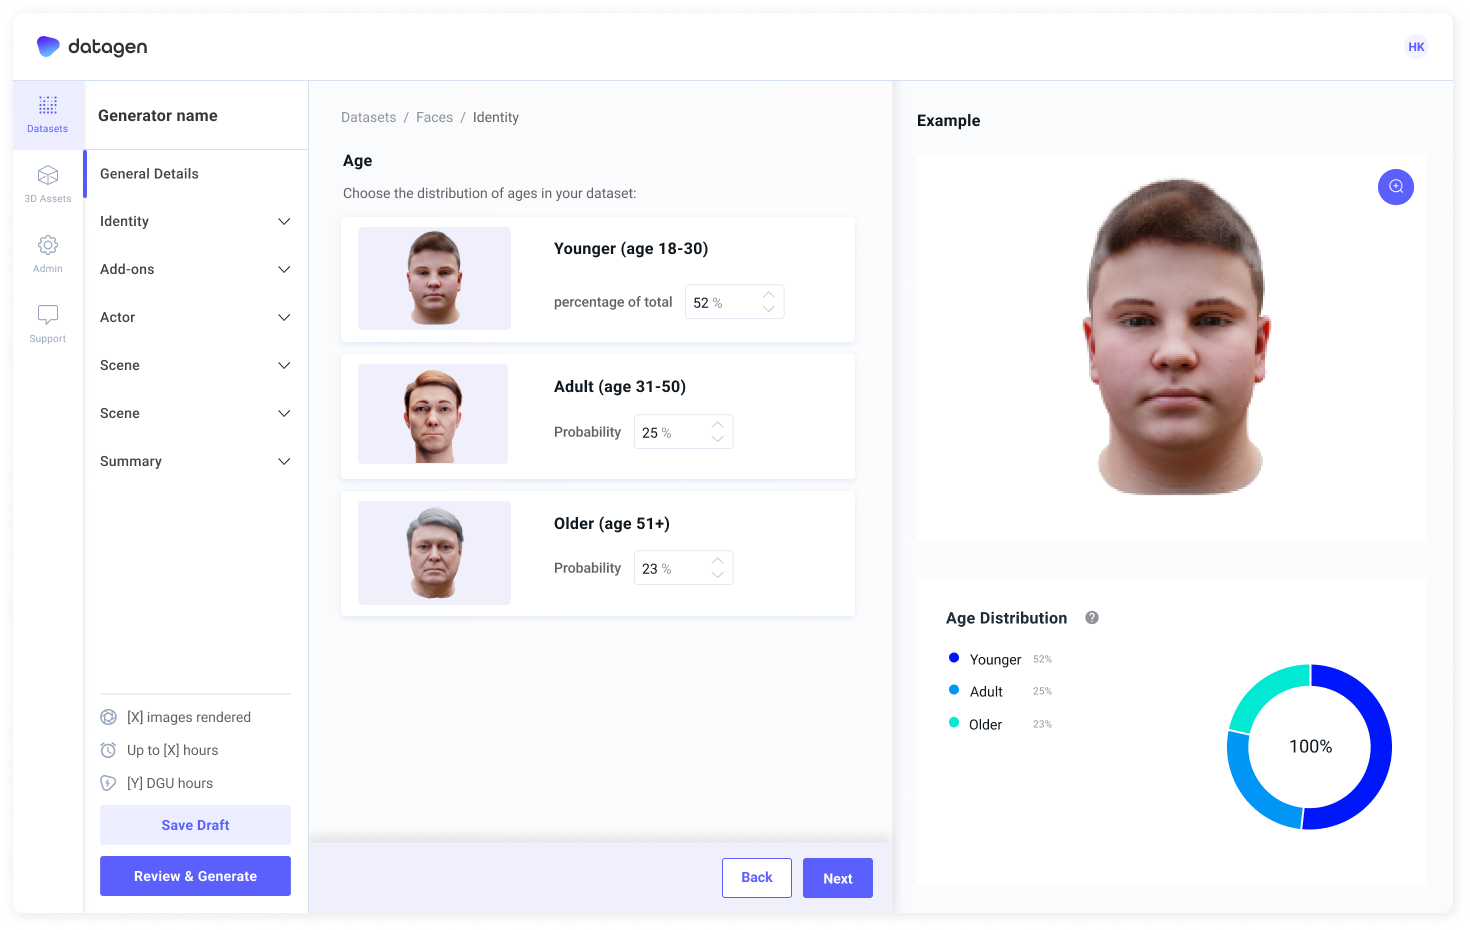
Age
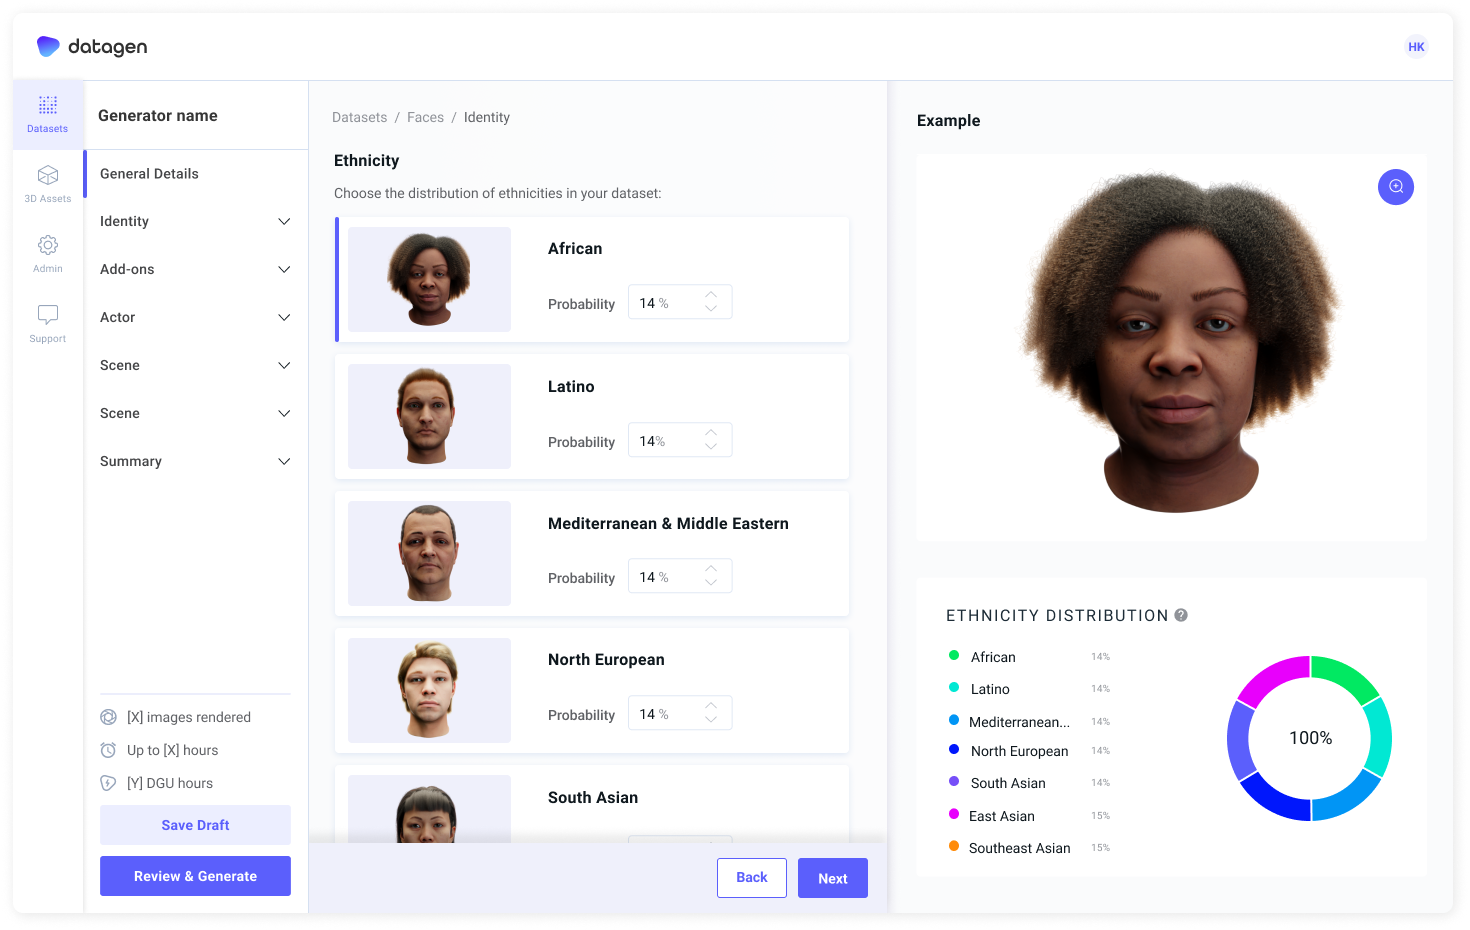
Ethnicity
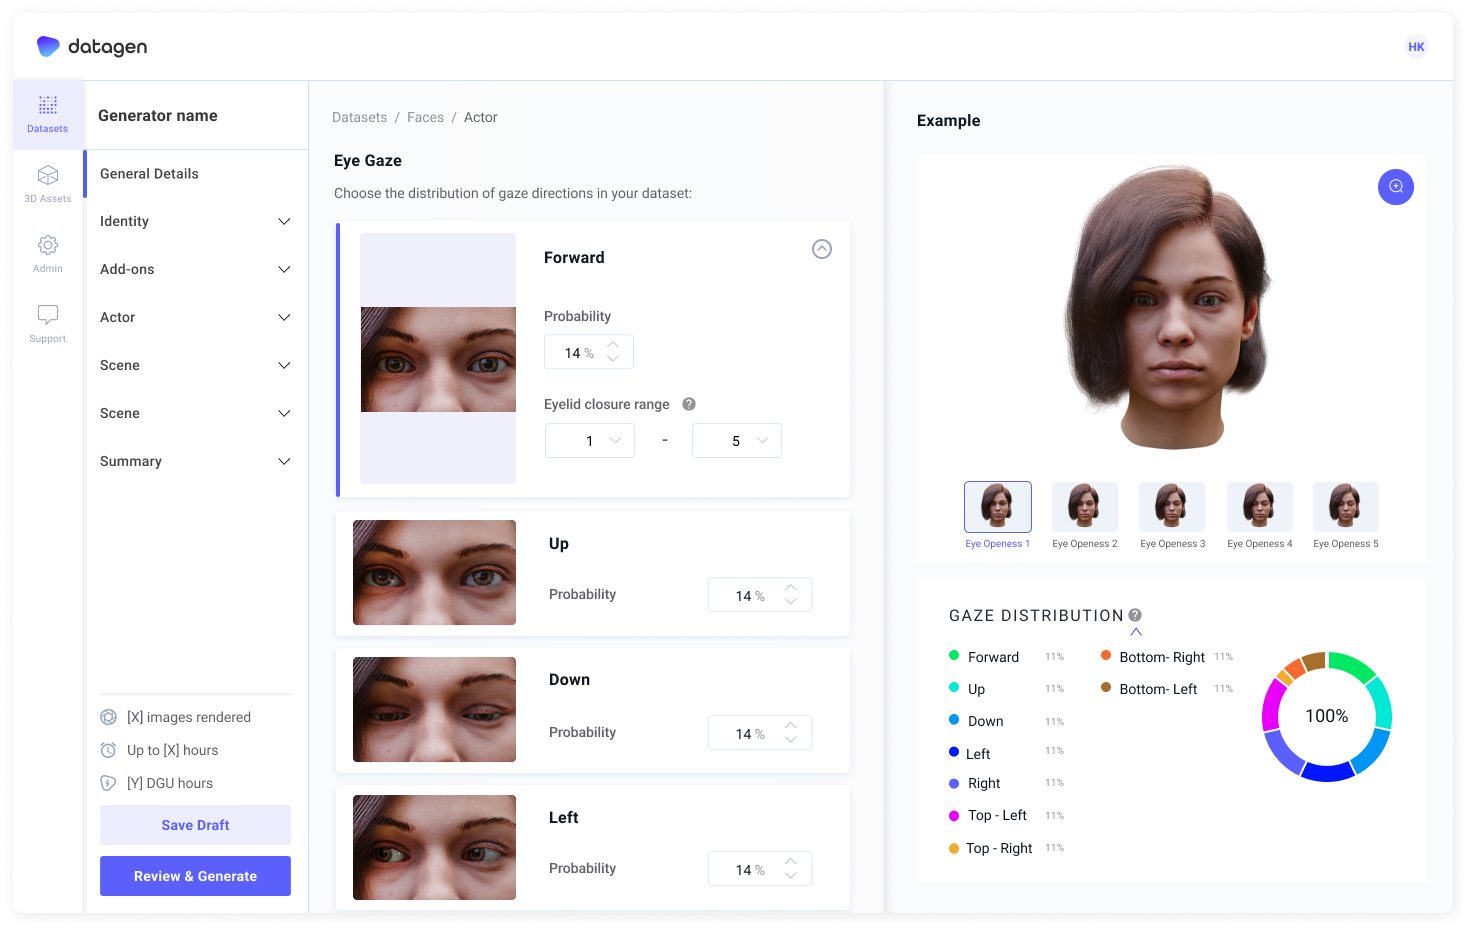
Eye gaze
Beards
Expressions
Accessories
Lighting
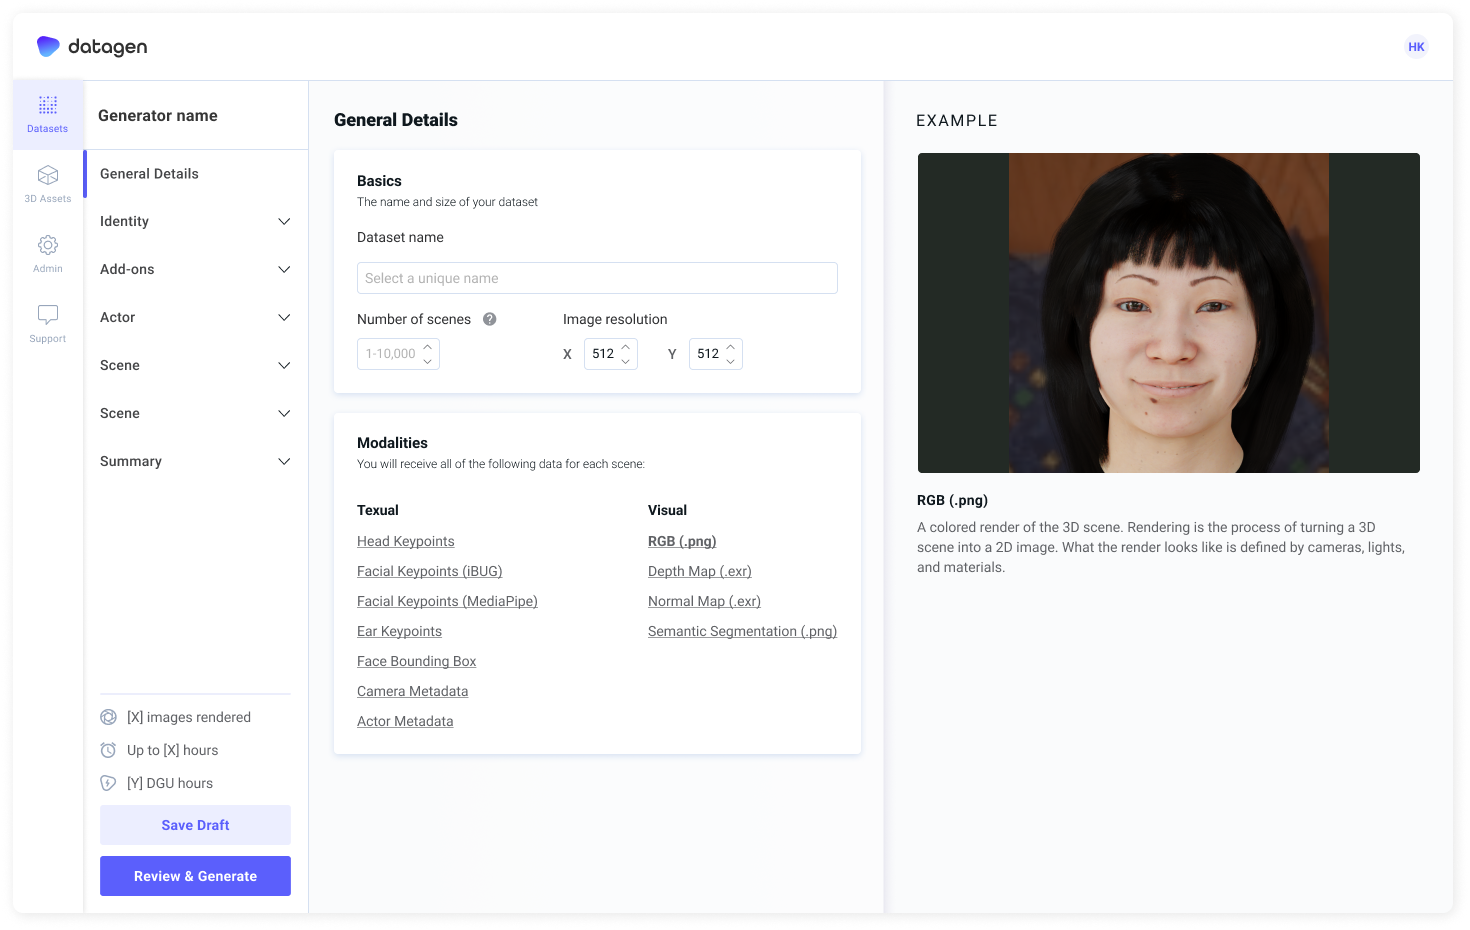
General details
Exploring data
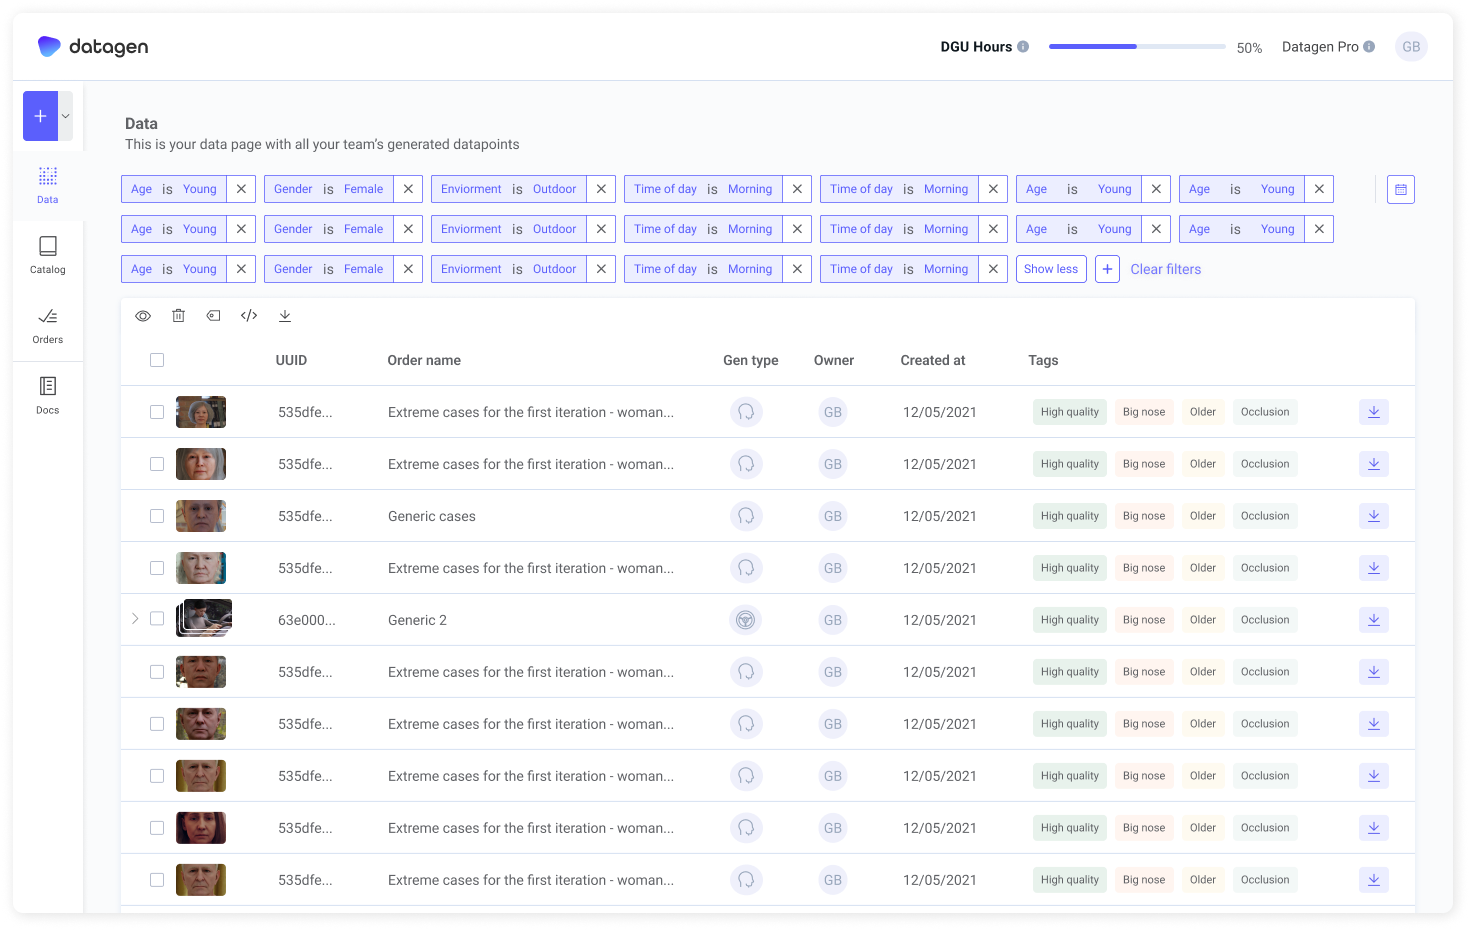
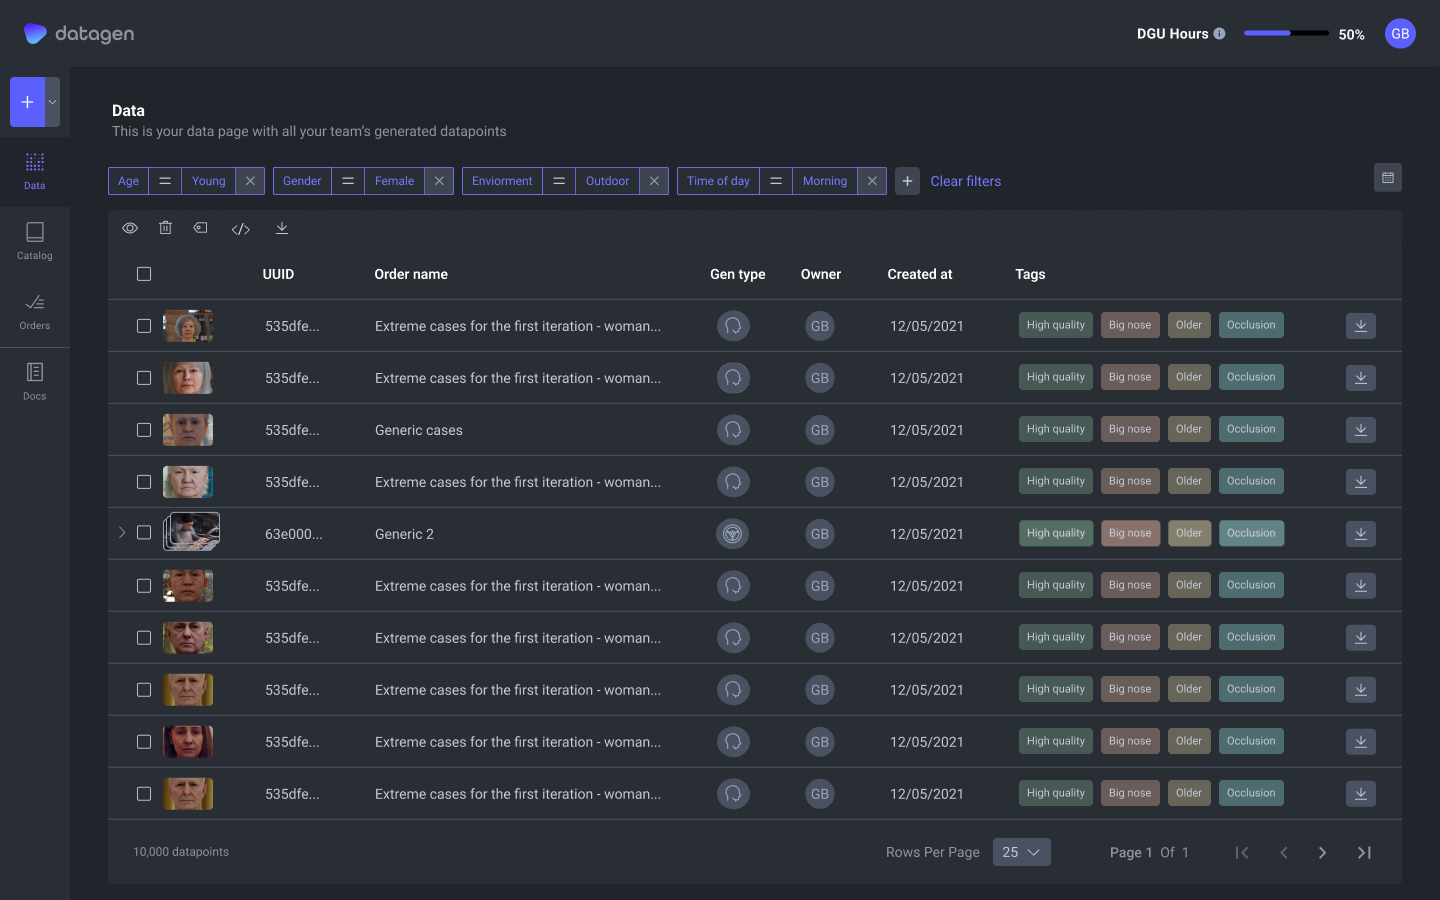
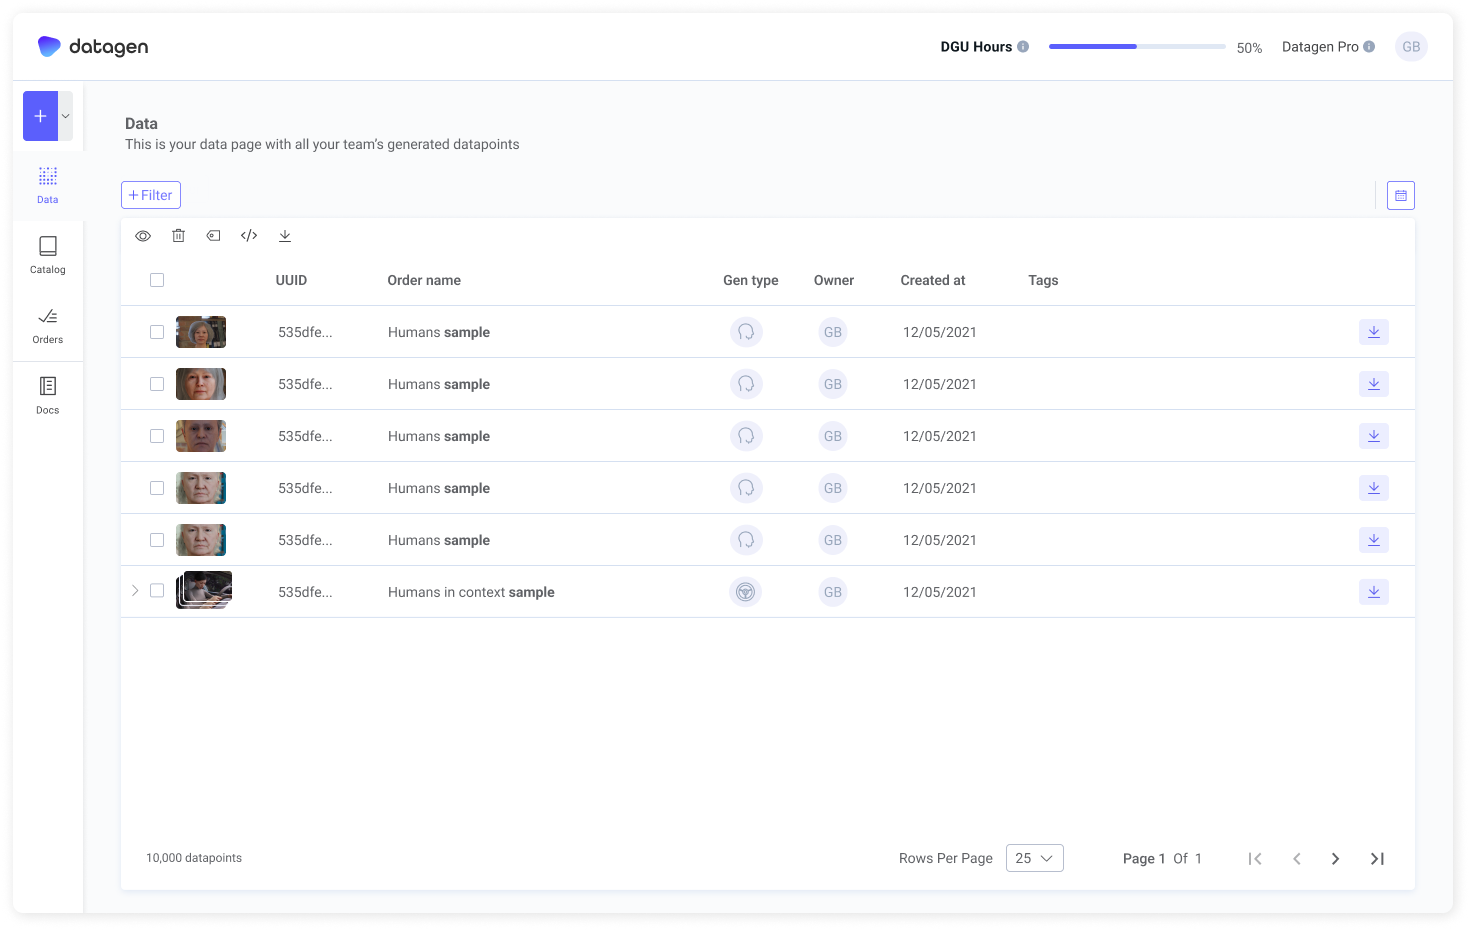
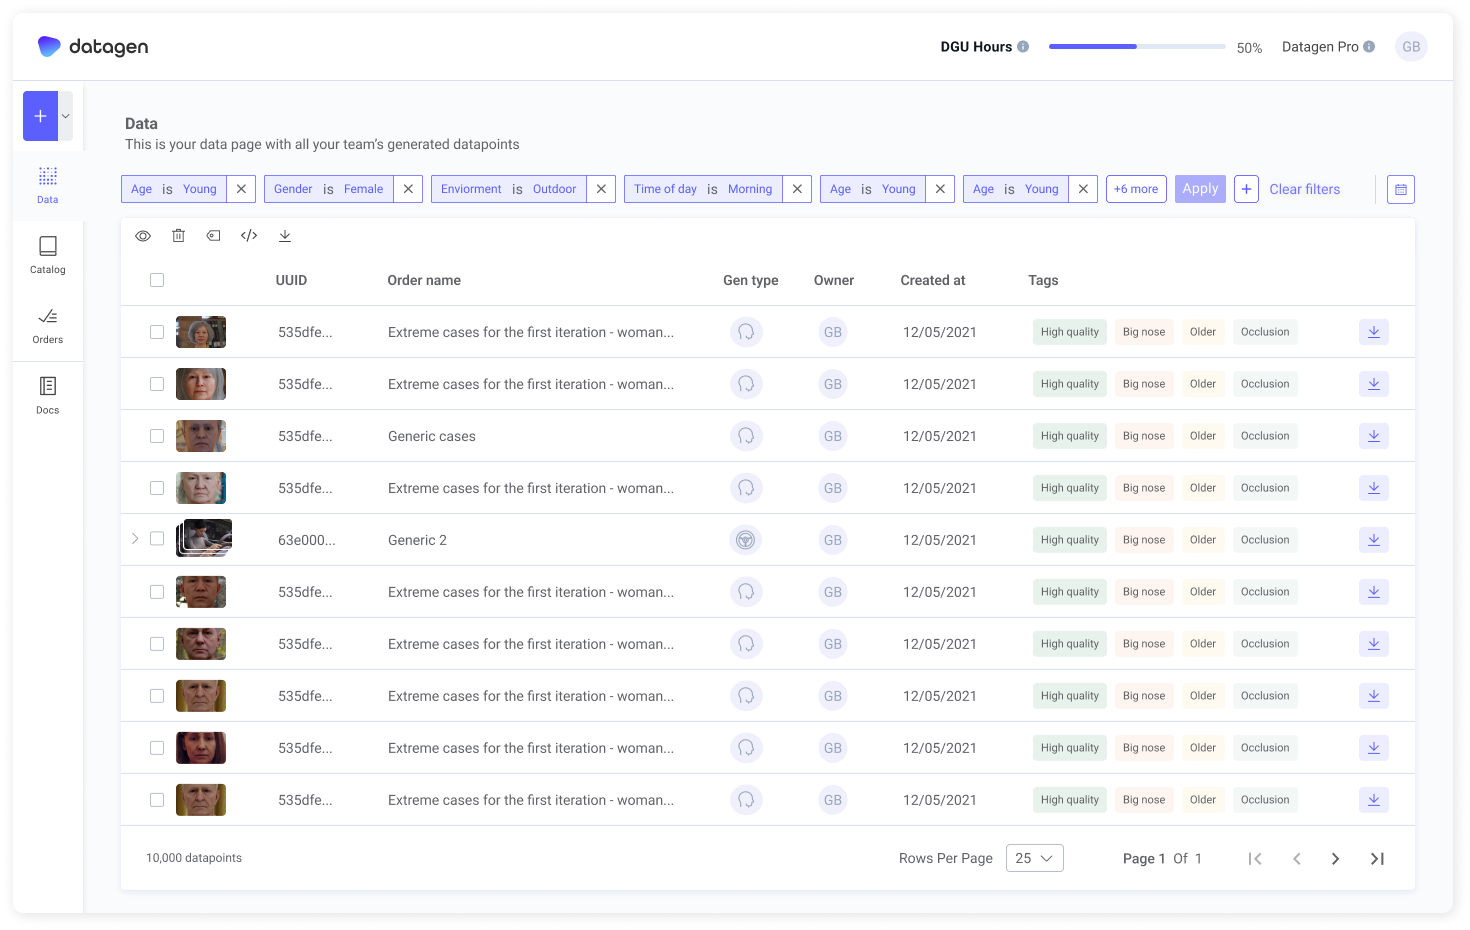
After creating the data, there is a library where all the created data is shown.
Since each image has a lot of metadata, I chose to present the data in a table view.
This allows users to see the image along with the most important metadata they have.
After creating the data, there is a library where all the created data is shown.
Since each image has a lot of metadata, I chose to present the data in a table view.
This allows users to see the image along with the most important metadata they have.
Filtering data
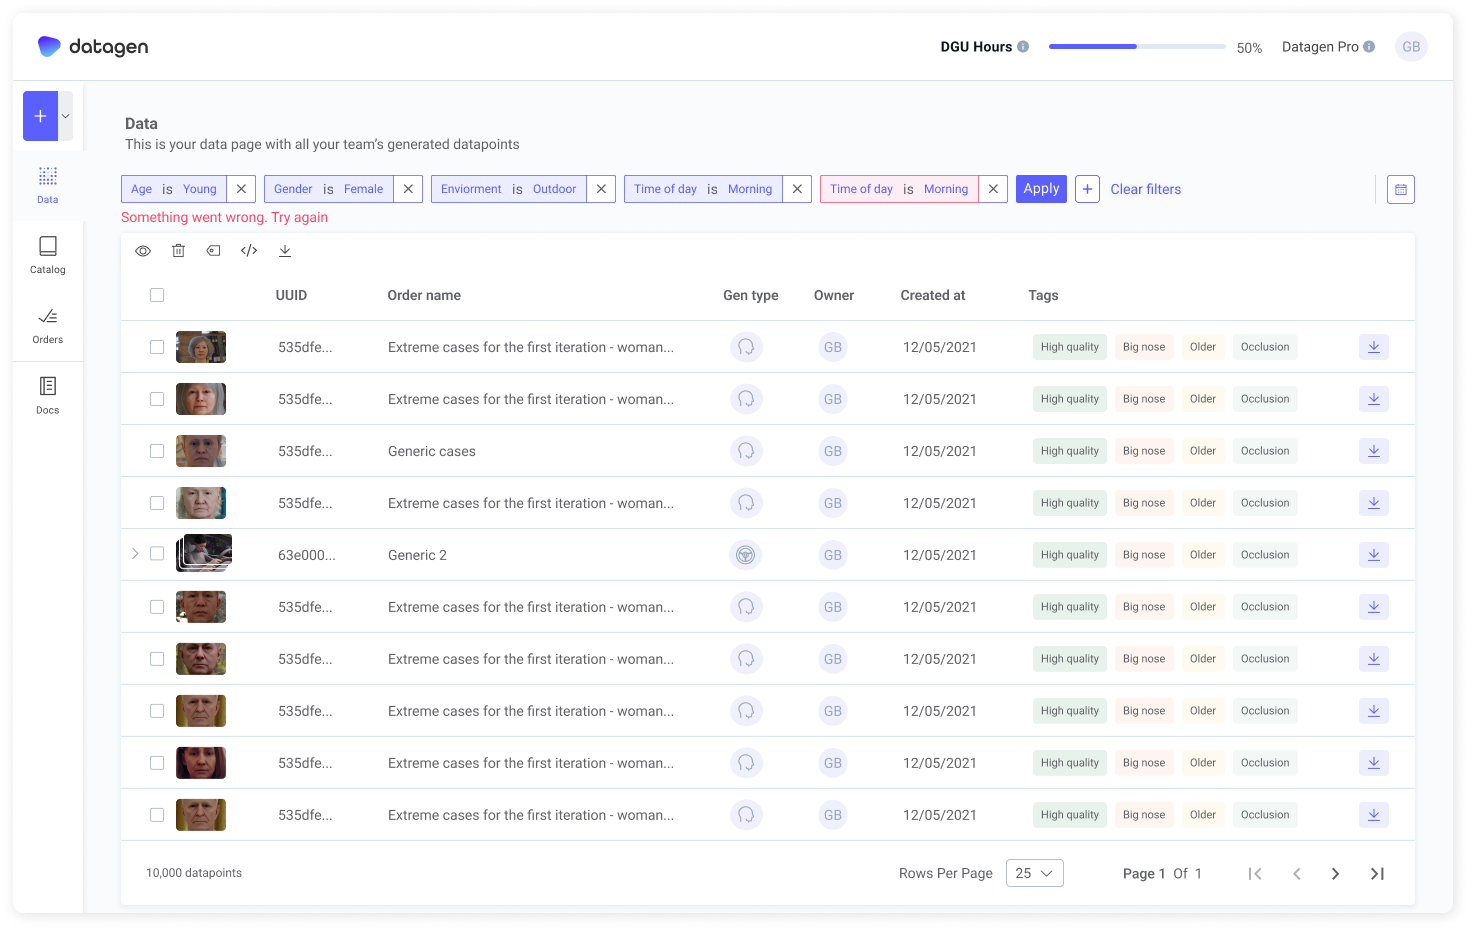
Because our users are very technical people who require advanced and complex filtering, I used a filter that allows you to search by any parameter (out of 60) or a combination of several of them.
To simplify the work, the filter walks the user through each step.
Because our users are very technical people who require advanced and complex filtering, I used a filter that allows you to search by any parameter (out of 60) or a combination of several of them.
To simplify the work, the filter walks the user through each step.
Time frame filter
tt
Quick filter by field value
In order to filter quickly by the parameter shown,
I added an option to hover over any given field, then a
filter icon appears, and clicking on it will add a filter.
In order to filter quickly by the parameter shown,
I added an option to hover over any given field, then a
filter icon appears, and clicking on it will add a filter.
Investigating data
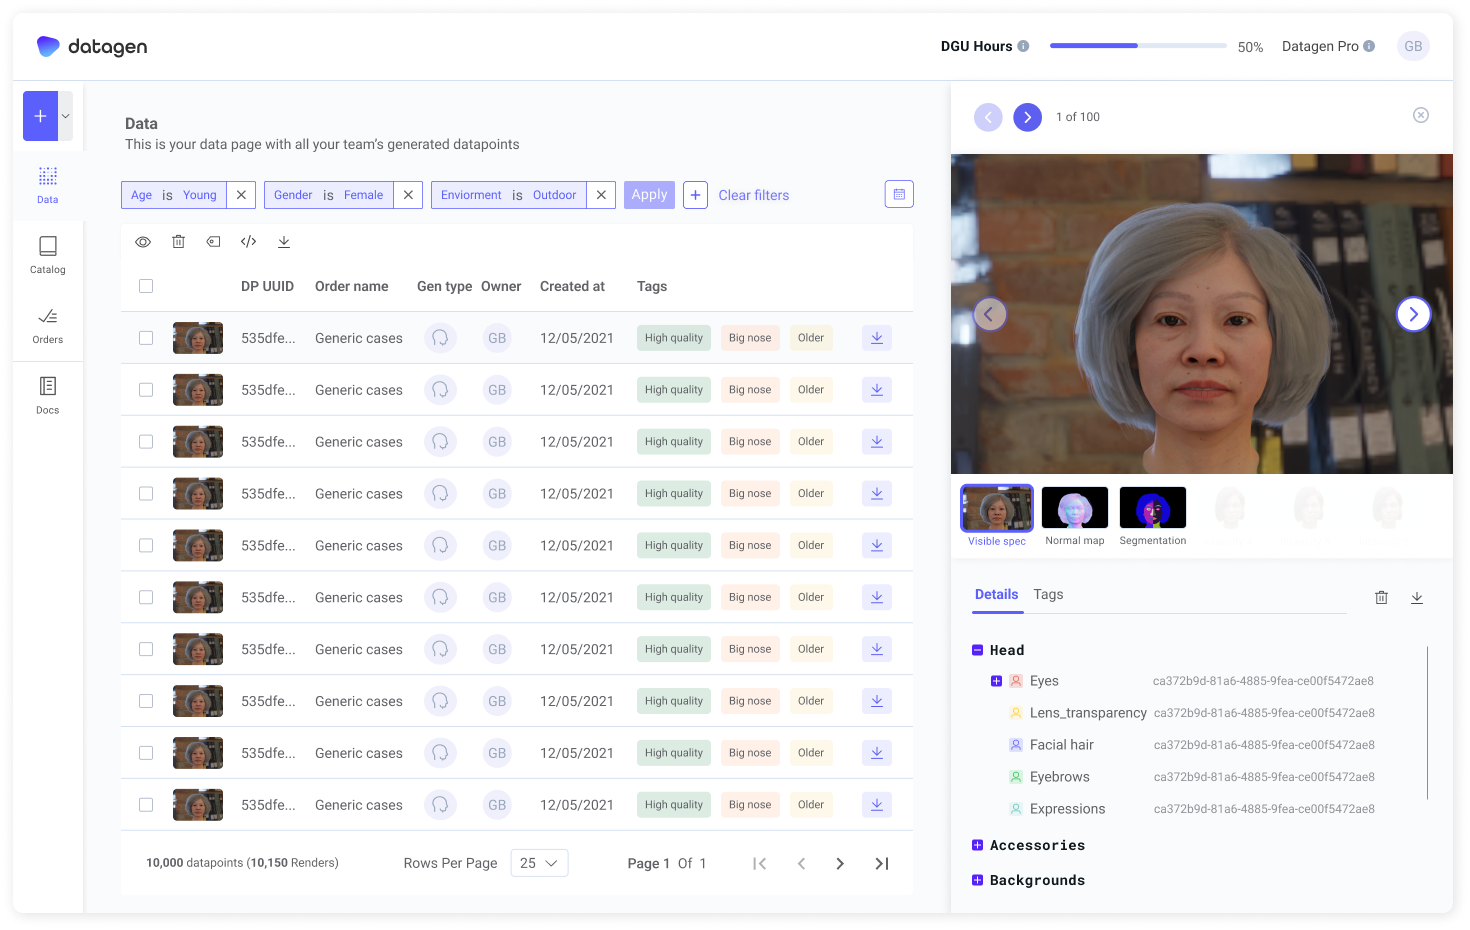
For investigating purposes I chose to show the images on a side panel so the user wouldn't lose focus on the table.
In that way, they can look over images and still be aware of the rest of the data in the table.
Using this side panel, the user can view the image and its modes, view the image metadata, and manage tags.
In that way, they can look over images and still be aware of the rest of the data in the table.
Using this side panel, the user can view the image and its modes, view the image metadata, and manage tags.
Action buttons
Download
Opens a dialog window that allows you to give it a name, choose which modalities to download, estimated size, and tag the downloaded data points.
Code view
In order to do changes to a certain image, you need to get the code that created this image and then you can do changes to it.
Tag
Be able to put your tags to organize your own data
Delete
Delete data that bothers the user
View
Opens one or more data points side panel
Other screens
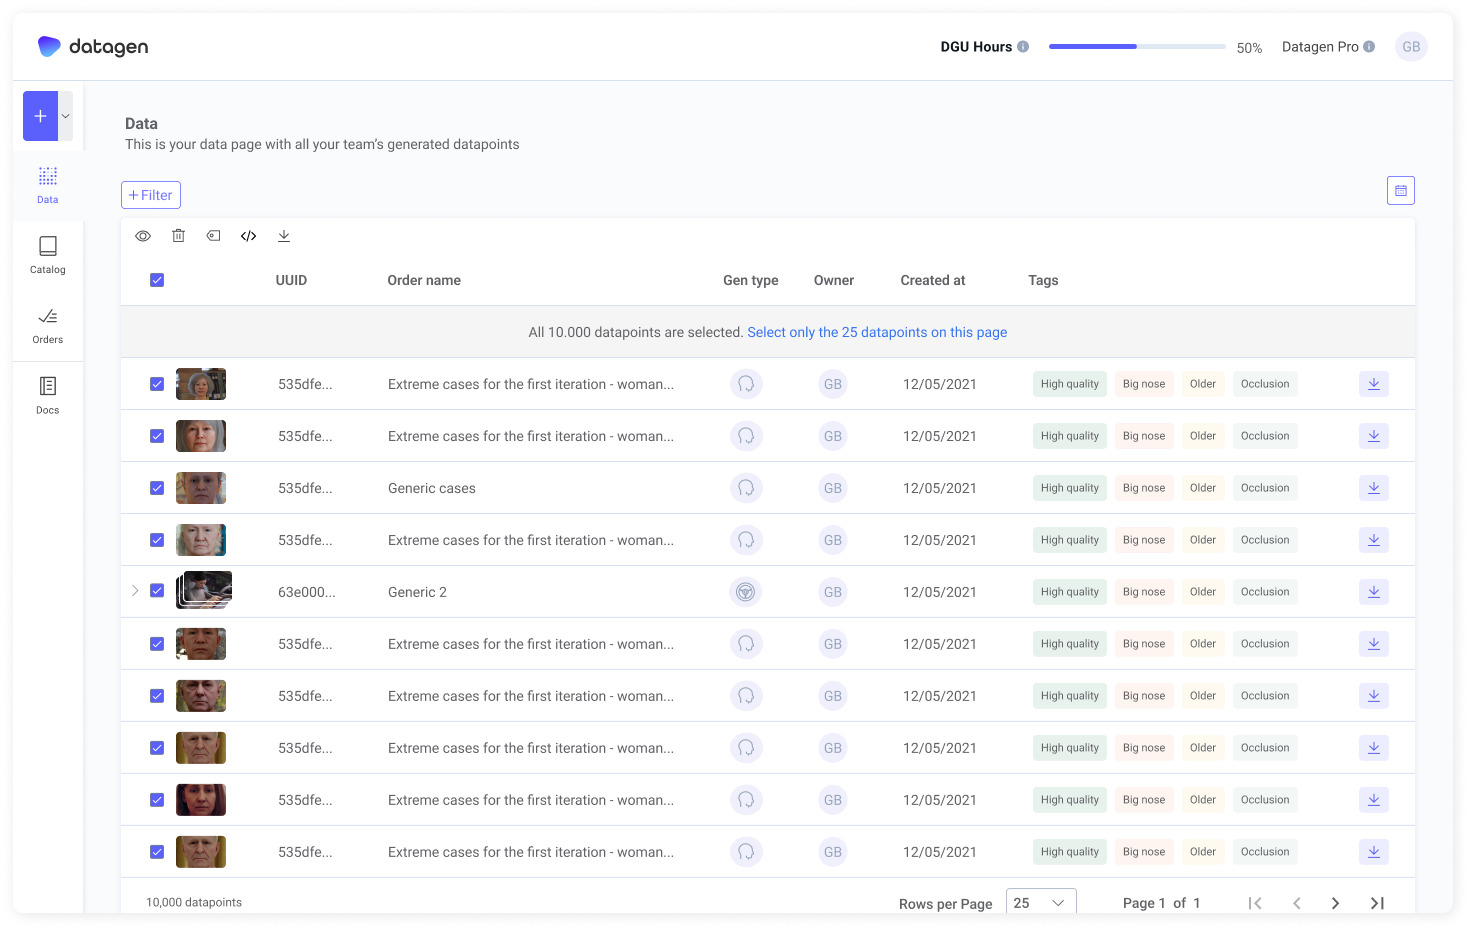
When all data points are selected
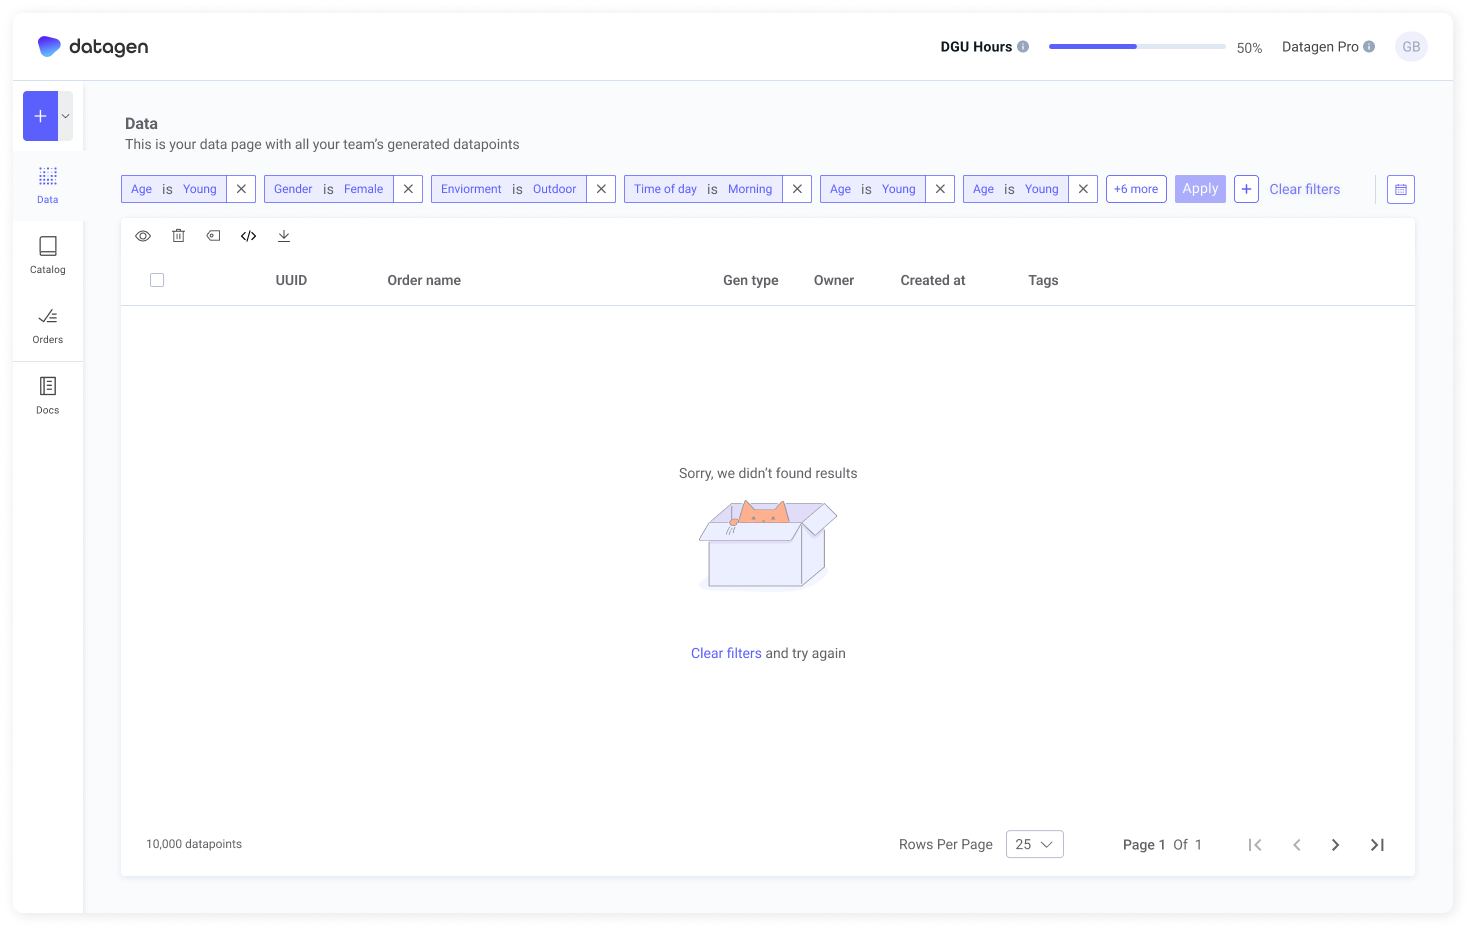
When there is no results
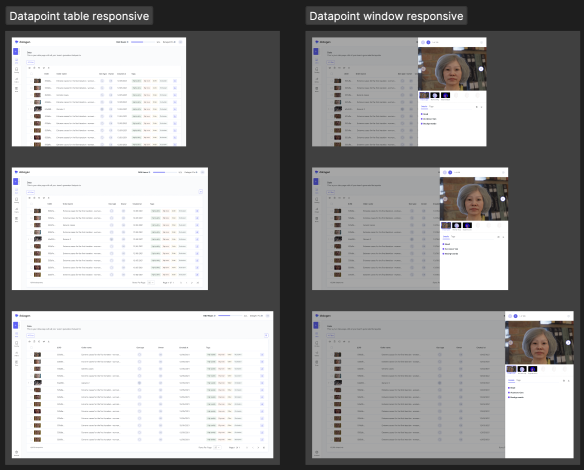
Responsive design
Dark mode
Error filter
Filtered by Metadata
First login
More that 1 row of filters - close
